Plot control charts
ss.cc(type, data, cdata, CTQ = names(data)[1], groups, climits, nsigmas = 3)Arguments
- type
Type of chart (see details)
- data
data.frame with the process data.
- cdata
Vector with the controlled process data to compute limits.
- CTQ
Name of the column in the data.frame containing the CTQ.
- groups
Name of the column in the data.frame containing the groups.
- climits
Limits of the controlled process. It should contain three ordered values: lower limit, center line and upper limit.
- nsigmas
Number of sigmas to compute the limits from the center line (default is 3)
Value
A plot with the control chart, and a list with the following elements:
- LCL
Lower Control Limit
- CL
Center Line
- UCL
Upper Control Limit
- phase
II when cdata or climits are provided. I otherwise.
- out
Out of control points
Details
If control limits are provided, cdata is dismissed and a message is
shown. If there are no control limits nor controlled data, the limits are
computed using data.
Supported types of control charts:
mrMoving Range
Note
We have created this function since the qAnalyst package has been
removed from CRAN, and it was used in the "Six Sigma with R" book to
plot moving average control charts.
References
Cano, Emilio L., Moguerza, Javier M. and Redchuk, Andres. 2012. Six Sigma with R. Statistical Engineering for Process Improvement, Use R!, vol. 36. Springer, New York. https://link.springer.com/book/10.1007/978-1-4614-3652-2/.
See also
Examples
ss.cc("mr", ss.data.pb1, CTQ = "pb.humidity")
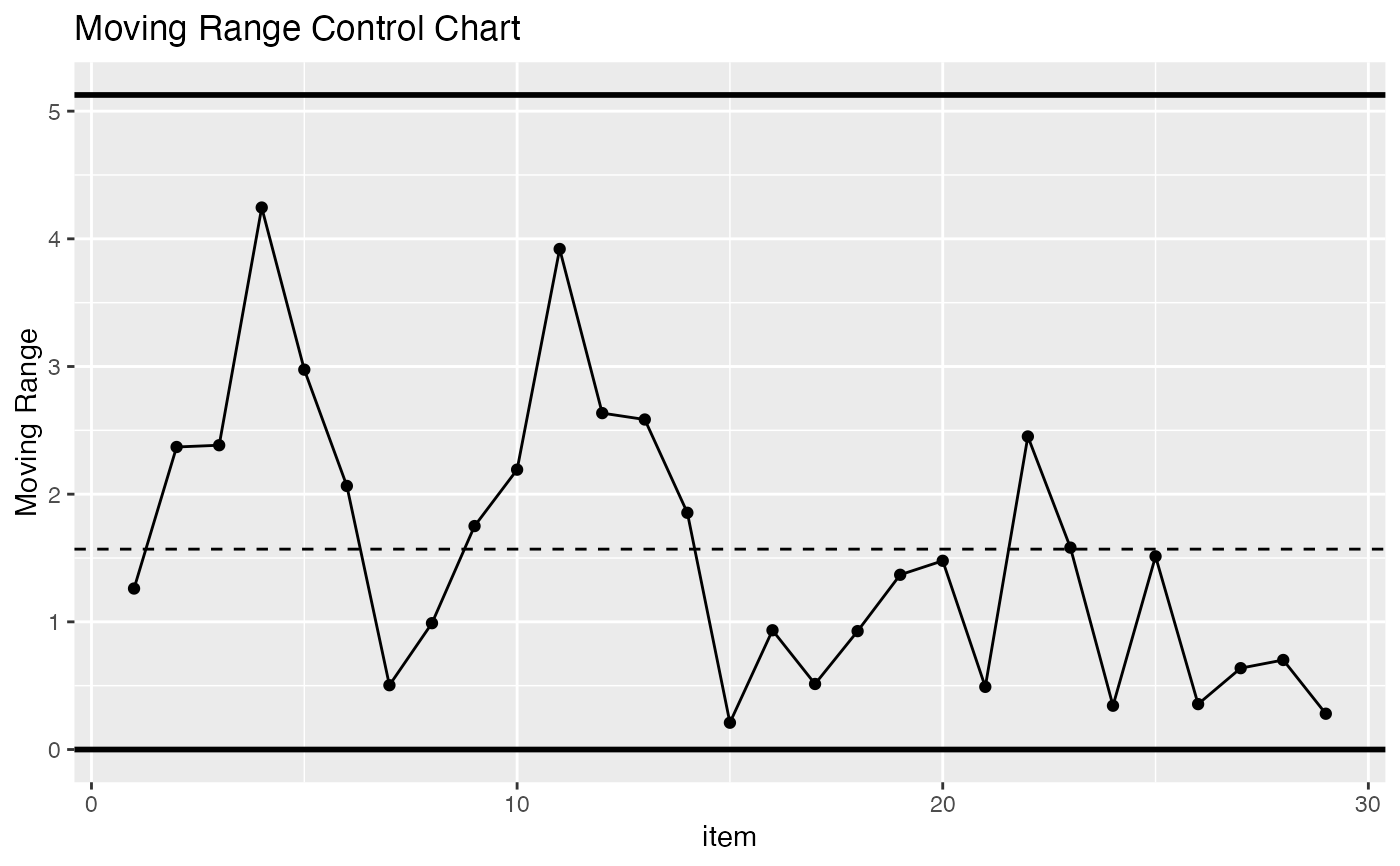 #> Phase I limits:
#> LCL CL UCL
#> 0.000000 1.569483 5.126767
#>
#> Out of control Moving Range:
#> None
testout <- ss.data.pb1
testout[31,] <- list(31,17)
ss.cc("mr", testout, CTQ = "pb.humidity")
#> Phase I limits:
#> LCL CL UCL
#> 0.000000 1.569483 5.126767
#>
#> Out of control Moving Range:
#> None
testout <- ss.data.pb1
testout[31,] <- list(31,17)
ss.cc("mr", testout, CTQ = "pb.humidity")
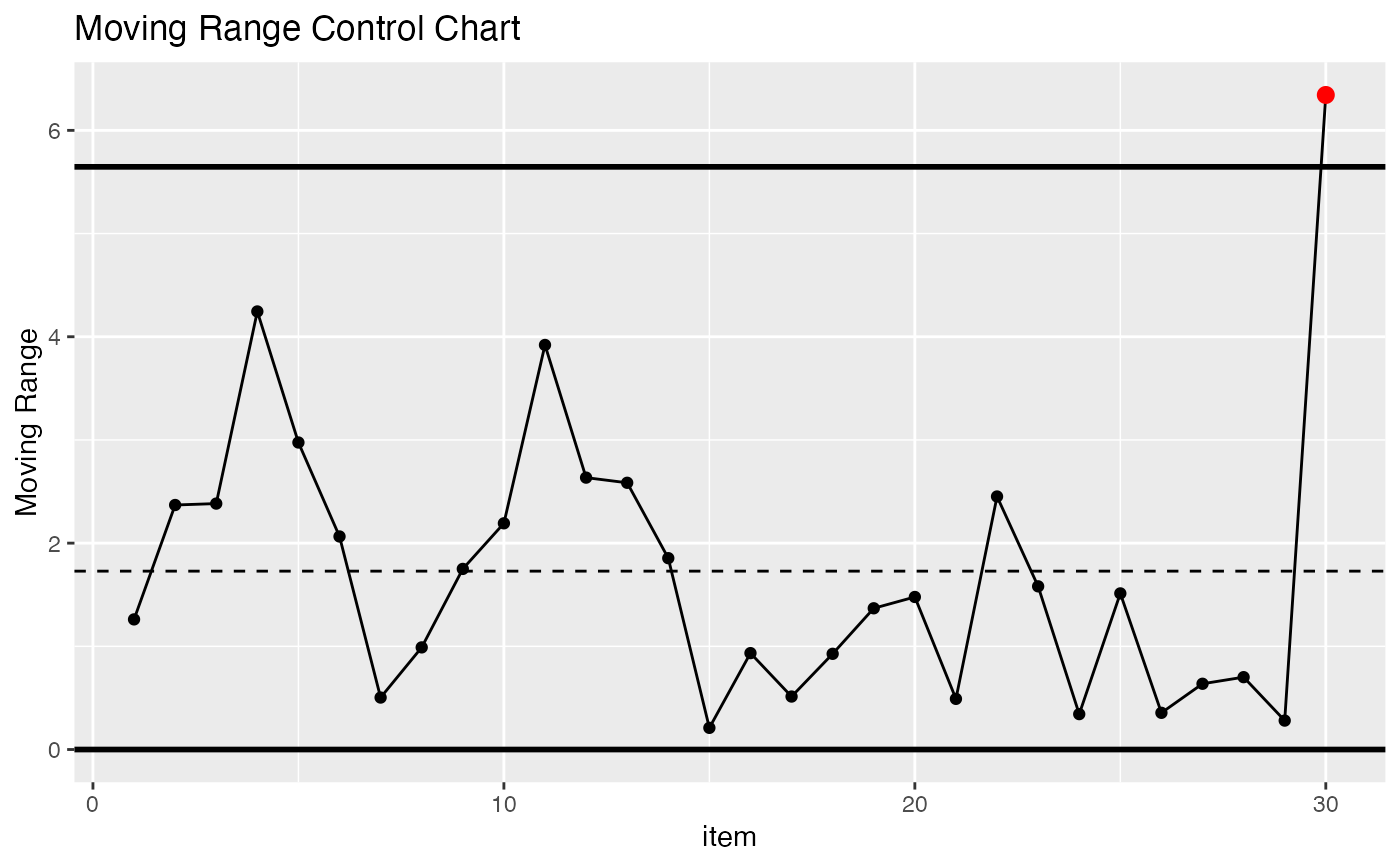 #> Phase I limits:
#> LCL CL UCL
#> 0.000000 1.728600 5.646528
#>
#> Out of control Moving Range:
#> [1] 30
#> Phase I limits:
#> LCL CL UCL
#> 0.000000 1.728600 5.646528
#>
#> Out of control Moving Range:
#> [1] 30