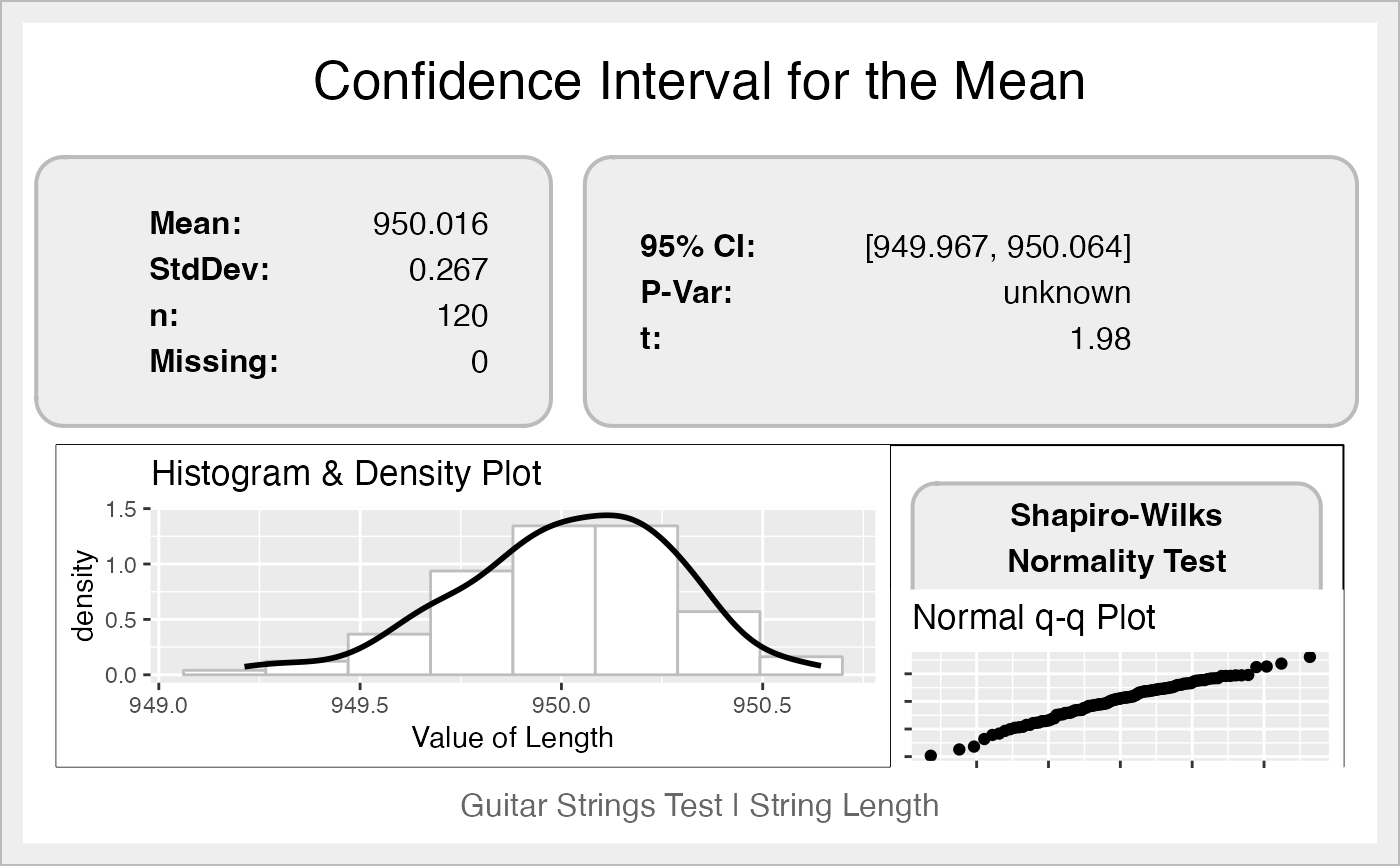
Computes a confidence interval for the mean of the variable (parameter or feature of the process), and prints the data, a histogram with a density line, the result of the Shapiro-Wilks normality test and a quantile-quantile plot.
ss.ci(
  x,
  sigma2 = NA,
  alpha = 0.05,
  data = NA,
  xname = "x",
  approx.z = FALSE,
  main = "Confidence Interval for the Mean",
  digits = 3,
  sub = "",
  ss.col = c("#666666", "#BBBBBB", "#CCCCCC", "#DDDDDD", "#EEEEEE", "#FFFFFF", "#000000",
    "#000000")
)
Arguments
- x
A numeric vector with the variable data
- sigma2
The population variance, if known
- alpha
The eqn\alpha error used to compute the \(100*(1-\\alpha)\%\) confidence interval
- data
The data frame containing the vector
- xname
The name of the variable to be shown in the graph
- approx.z
If TRUE it uses z statistic instead of t when sigma is unknown and sample size is greater than 30. The default is FALSE, change only if you want to compare with results obtained with the old-fashioned method mentioned in some books.
- main
The main title for the graph
- digits
Significant digits for output
- sub
The subtitle for the graph (recommended: six sigma project name)
- ss.col
A vector with colors
Value
The confidence Interval.
A graph with the figures, the Shapiro-Wilks test, and a histogram.
Details
When the population variance is known, or the size is greater than 30,
it uses z statistic. Otherwise, it is uses t statistic.
If the sample size is lower than 30, a warning is displayed so as to
verify normality.
Note
Thanks to the kind comments and suggestions from the anonymous reviewer of a tentative article.
References
Cano, Emilio L., Moguerza, Javier M. and Redchuk, Andres. 2012. Six Sigma with R. Statistical Engineering for Process Improvement, Use R!, vol. 36. Springer, New York. https://link.springer.com/book/10.1007/978-1-4614-3652-2/.
See also
Examples
ss.ci(len, data=ss.data.strings, alpha = 0.05,
  sub = "Guitar Strings Test | String Length",
  xname = "Length")
#> 	Mean = 950.016; sd = 0.267
#> 	95% Confidence Interval= 949.967 to 950.064
#>

#>       LL       UL
#> 949.9674 950.0640
#> LL UL
#> 949.9674 950.0640