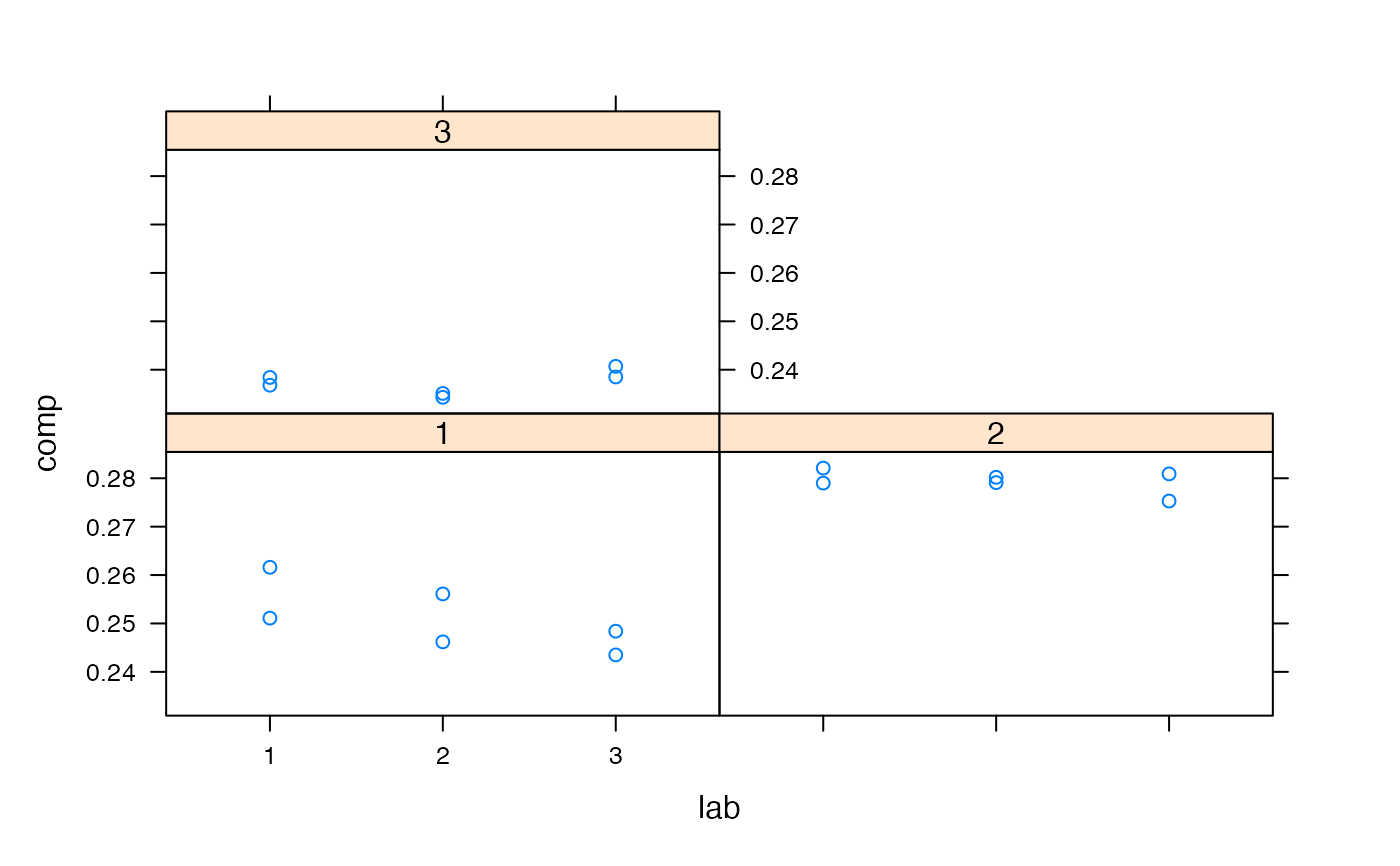
A data frame with 18 observations of the amount of the CTQ compound in some pastries from a bakery. There are two runs for each combination of two factors (laboratory and batch).
data(ss.data.pastries)Format
A data frame with 18 observations on the following 4 variables.
lablaboratory: a factor with levels
123batchbatch: a factor with levels
123runidentifies the run: a factor with levels
12compproportion of the compound in the pastry: a numeric vector
Source
See references.
Note
This data set is used in chapter 5 exercises of the book ``Six Sigma with R'' (see References).
References
Cano, Emilio L., Moguerza, Javier M. and Redchuk, Andrés. 2012.
Six Sigma with R. Statistical Engineering for Process
Improvement, Use R!, vol. 36. Springer, New York.
https://link.springer.com/book/10.1007/978-1-4614-3652-2/.