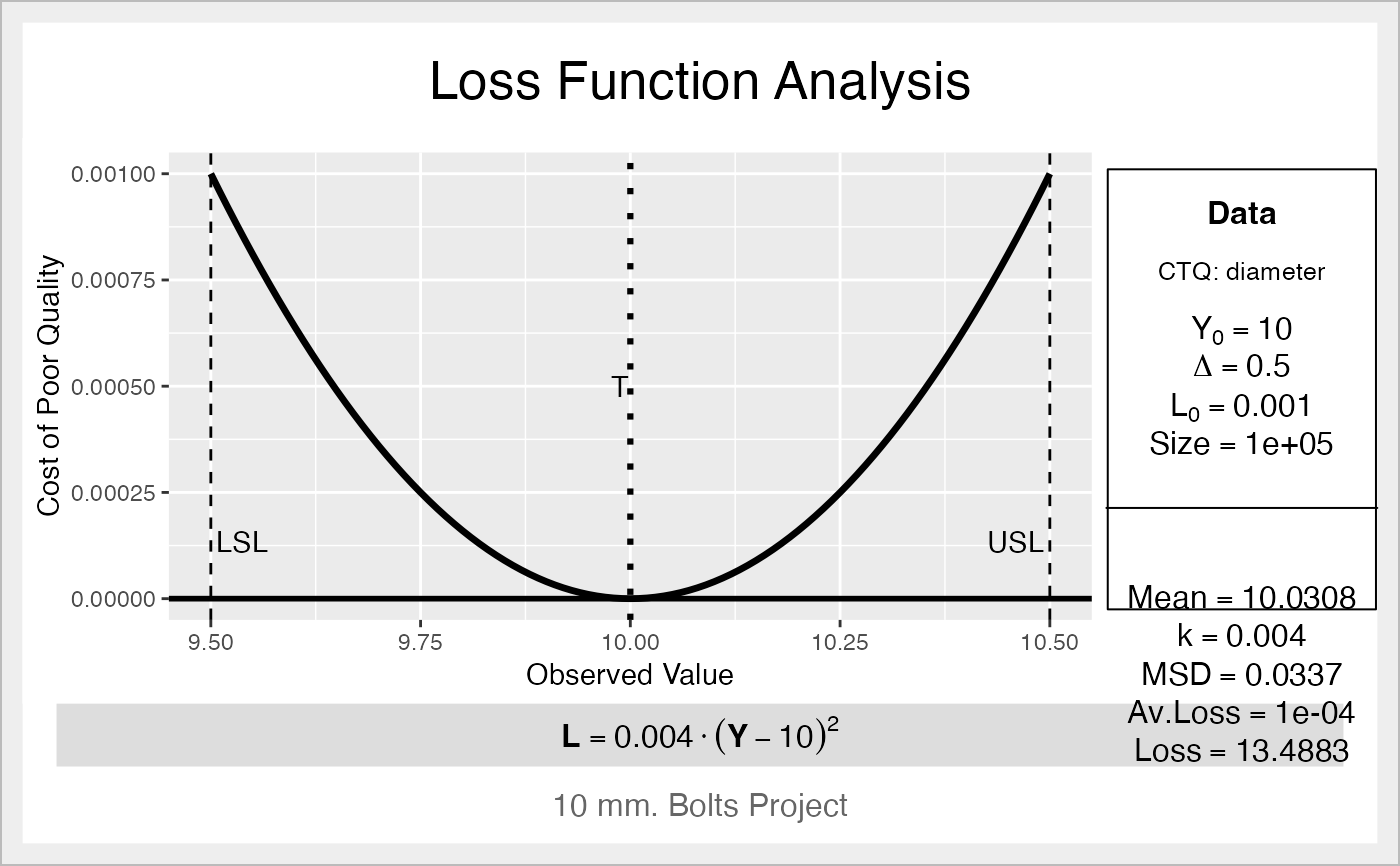
This function performs a Quality Loss Function Analysis, based in the Taguchi Loss Function for "Nominal-the-Best" characteristics.
ss.lfa(
  lfa.data,
  lfa.ctq,
  lfa.Delta,
  lfa.Y0,
  lfa.L0,
  lfa.size = NA,
  lfa.output = "both",
  lfa.sub = "Six Sigma Project"
)
Arguments
- lfa.data
Data frame with the sample to get the average loss.
- lfa.ctq
Name of the field in the data frame containing the data.
- lfa.Delta
Tolerance of the process.
- lfa.Y0
Target of the process (see note).
- lfa.L0
Cost of poor quality at tolerance limit.
- lfa.size
Size of the production, batch, etc. to calculate the total loss in a group (span, batch, period, ...)
- lfa.output
Type of output (see details).
- lfa.sub
Subtitle for the graphic output.
Value
- lfa.k
Constant k for the loss function
- lfa,lf
Expression with the loss function
- lfa.MSD
Mean Squared Differences from the target
- lfa.avLoss
Average Loss per unit of the process
- lfa.Loss
Total Loss of the process (if a size is provided)
Details
lfa.output can take the values "text", "plot" or "both".
Note
For smaller-the-better characteristics, the target should be zero (lfa.Y0 = 0).
For larger-the-better characteristics, the target should be infinity (lfa.Y0 = Inf).
References
Taguchi G, Chowdhury S,Wu Y (2005) Taguchi's quality engineering handbook. John
Wiley
Cano, Emilio L., Moguerza, Javier M. and Redchuk, Andres. 2012.
Six Sigma with R. Statistical Engineering for Process
Improvement, Use R!, vol. 36. Springer, New York.
https://link.springer.com/book/10.1007/978-1-4614-3652-2/.
See also
Examples
ss.lfa(ss.data.bolts, "diameter", 0.5, 10, 0.001,
    lfa.sub = "10 mm. Bolts Project",
    lfa.size = 100000, lfa.output = "both")

#> $lfa.k
#> [1] 0.004
#>
#> $lfa.lf
#> expression(bold(L == 0.004 %.% (Y - 10)^2))
#>
#> $lfa.MSD
#> [1] 0.03372065
#>
#> $lfa.avLoss
#> [1] 0.0001348826
#>
#> $lfa.Loss
#> [1] 13.48826
#>